Back to Energy Manager Main Menu
Custom reports
Creating a Custom report in your Energy Manager account gives you the flexibility to build reports that show only the data you want to see. To use custom reporting, you first need to create a Report Definition. Once the Report Definition has been set up, you can generate the report.
How to create a report definition
*Note: Anything with a double asterisk ( ) is a required field.
- Click on Reports & Charts from the navigation menu, then select Custom Reports.
- Click on Report Definitions.
_330x477.png)
- Click +Add Report at the top of the menu on the left hand side of the page.
_352x129.png)
- Fill out the fields on the General tab.
- Report Name: It is recommended to keep this simple but descriptive, so you can easily identify what data the report will return (ex: All Utilities - Yearly Use & Cost per Sq Ft Comparison).
- Description: Use this field to further describe the report if needed.
- Report Type:
- Historical Use & Cost breaks data down month by month.
- Use & Cost Ranking compares data.
- Utility Bill Info returns line item data.
- General Data List includes the Account, Vendor, Meter, or Facility data.
- Created by: This will automatically populate the name of the user creating the report. This field cannot be changed.
- Viewable by all: If checked, all users in the account will be able to view the report. If unchecked, only the creator of the report will be able to view it.
- Editable by all: If checked, all users in the account will be able to edit and/or delete the report. If unchecked, only the creator of the report will be able to edit and/or delete it.
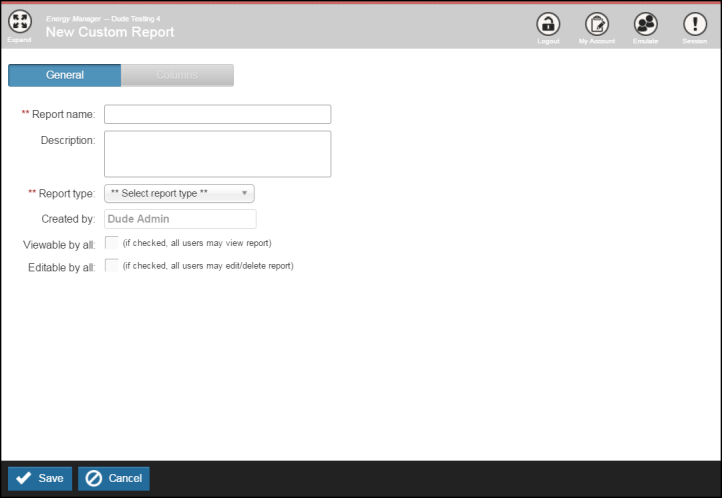
- Click Save.
- A pop-up window will appear stating that a new record has been added, and will ask if you want to add another. Click Yes to create another custom report definition, or click No to proceed to the next step of creating the current custom report definition.
- Click on the Columns tab to begin defining the column headers in your report.
- Click +Add Column.
![]()
- A pop-up window will appear to Add a New Column. The fields that populate in the window will vary based on the Report Type selected on the General tab. In this example, Historical Use & Cost was selected as the report type.
- Position: This determines the order of the columns and can be rearranged later on if needed.
- Column Heading: The text you enter here is what will show as the column header on the report. If left blank, it will default to the selection in the Data Item or Field drop down menu. *Note: Data Item applies to the Historical Use & Cost and Use & Cost Ranking report types. Field applies to the Utility Bill Info and General Data List report types.
- Service: Select the appropriate utility type.
- Data Item or Field: This will vary based on the report type selected. Select the appropriate option for your needs.
- Data Scope: *Note: This field only applies to the Historical Use & Cost and Use & Cost Ranking report types.
- Current Year shows data for the current year/time period selected.
- Comparison Year compares the current year data to a prior year.
- % Change provides a percentage to indicate the difference between the current year and a prior year.
- Aggregate: *Note: This field only applies to the Historical Use & Cost report type.
- Monthly breaks out data by month for the time period selected.
- Annual breaks out data by month, and each month represents a rolling average of the previous 12 months.
- Decimals: Set the number of decimal places that you would like to appear in your report.
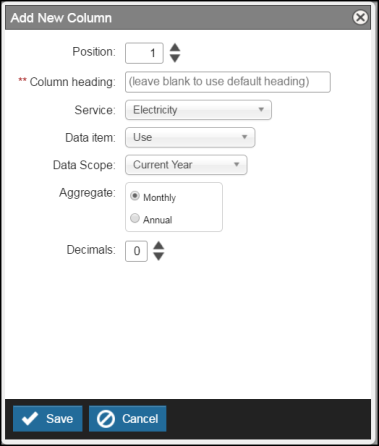
- Click Save.
- Repeat the process until you have added all of the necessary columns. Once all of your columns have been added, your report definition is complete and the report is ready to be generated.
How to generate a custom report
- Click on the Reports & Charts tab.
- Click on Custom Reports.
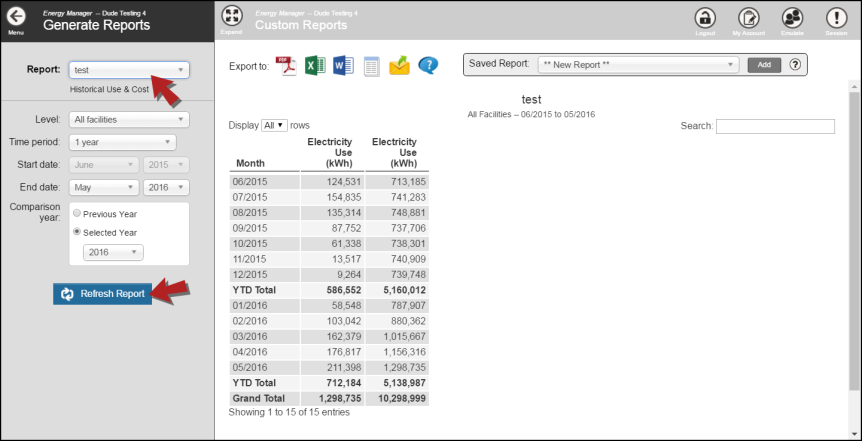
- Click on Generate Reports.
_325x470.png)
- Select the report that you would like to run from the Report drop down menu at the top left corner of the page.
- Select any applicable filters and then click Refresh Report. The data will appear on the right hand side of the page with the option to export to PDF, Excel, or Word, along with a few other options.